Frequently Asked Questions Tagged as Statistics Tab
An ad with higher rank is usually shown before with lower rank. Our scale for ad-rank ranges from 1-5, 1 being the higher and more desirable value. One of the primary function that determines the ad-rank is the relative bid price or cost per click (CPC) or cost per 1000 impressions (CPM) that an advertiser is willing to pay for an ad. Because of the dynamic nature of the real time bidding auction, the ad-rank is rarely stable. It fluctuates on a daily basis. However, a trend in ad-rank or an average ad-rank is a good parameter to identify whether an ad is doing well.
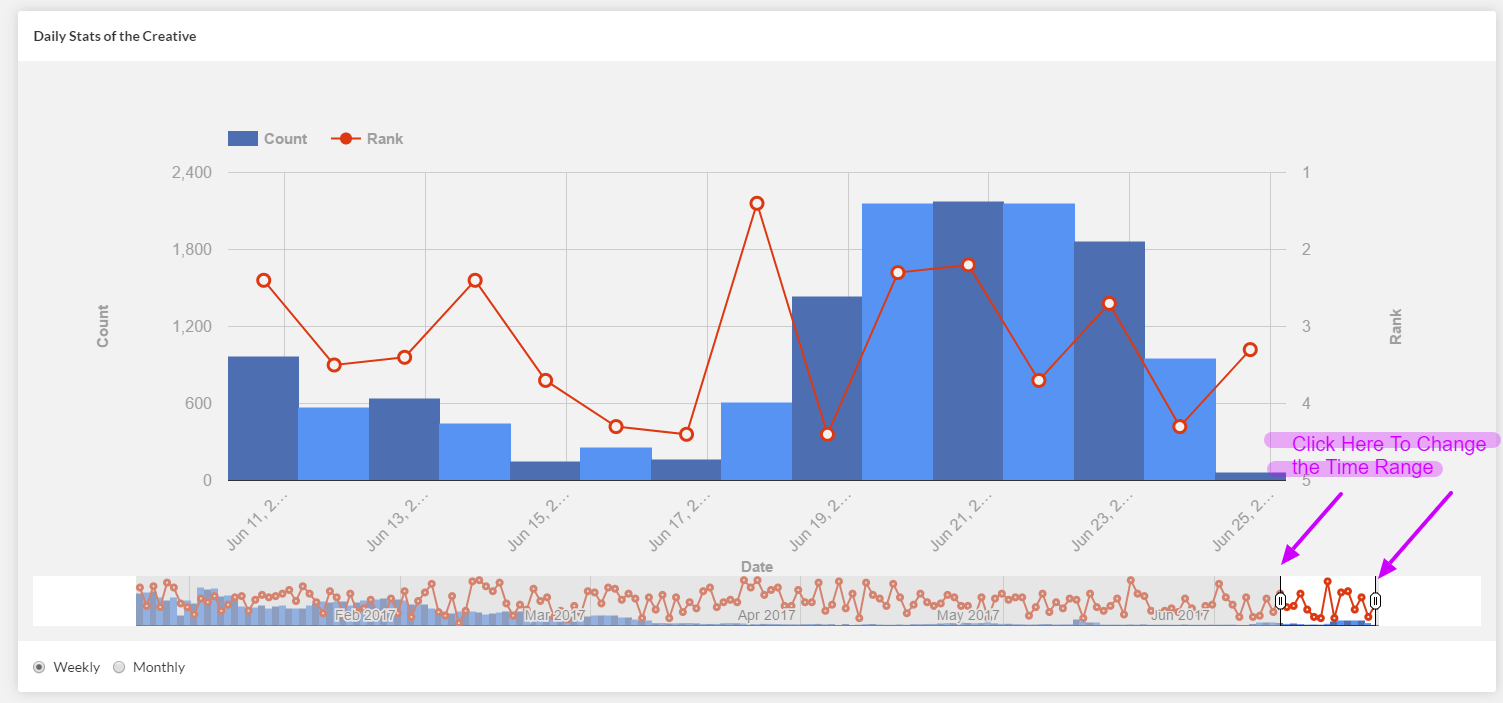
The default view shows the chart data from last two weeks. In order to change this two week time range you can click and drag the controllers on the rangefinder view right below the chart as indicated in the figure below. Maximum range is 1 year.
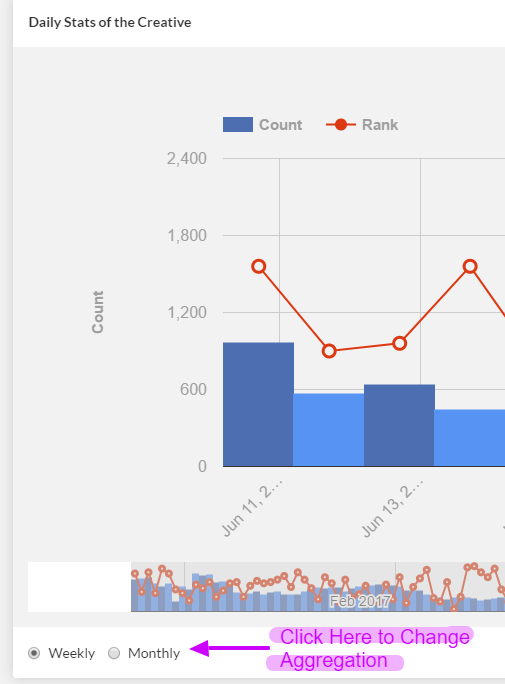
Additionally, you can change the aggregation from weekly to monthly or vice versa by clicking on the radio buttons at the bottom of the chart as shown below: