Dashboard Layout

Dashboard Layout
The dashboard layout can be divided into three sections as described below:
- Store Filter: These filters allow you to view or suppress the data for each connected store
- Date Range Filter: This filter allows you to define the date range for all the charts in the dashboard
- Data: The data section shows you the important sales and fulfillment parameters in the form of various charts or tables as described in the following section
Using Store Filter

Store filter allows you to include/exclude the data from each connected store into your dashboard charts and tables. You can enable or disable a store by checking or unchecking the box on the left of each connected store as shown in the figure above:
Using Date Range Filter
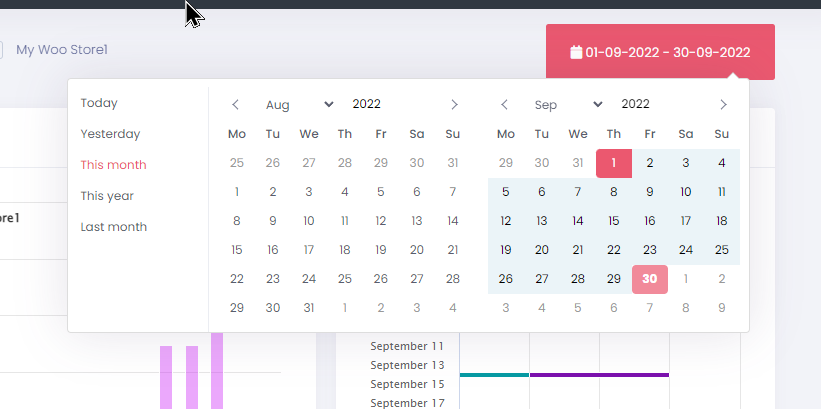
The date range filter shows a calendar window which allows you to select desired date range. There are several shortcuts on the left hand side to allow you to apply quick date range filters as shown in the screenshot below:
Data Section

Dashboard Charts
The actual data on the dashboard is presented in the form charts or tables as described below
- Sales Bar Chart: This chart shows sales activity as a function of time for each connected store. Sales are reported in the currency defined for your store. The time axis can be daily or monthly depending on the selected date range.
- Orders Chart: This chart shows number of orders for each connected stores against time. The time axis can be daily or monthly depending on the selected date range.
- Order Status Timeline: This is line chart that shows the orders received and orders fulfilled on a timeline. It gives you an insight into how quickly the orders are getting fulfilled by your supplier.
- Order Status Distribution: This is a pie chart that shows you overall distribution of orders received vs orders fulfilled. Ideally, the orders fulfilled and orders fulfilled distribution should be 50/50. The more it varies from 50/50 distribution, there is more lag between the two.
- Orders Table: This table gives you a quick glimpse into the status of various orders within the given date range. The table contains following columns
- Order ID (from your store)
- Store Name
- Number of Items in the order
- Payment Status
- Fulfillment Status
- Order Date
You can sort each column in ascending or descending order. By default it displays 10 orders per page. You can change that limit by clicking on the dropdown as shown.
You can also click on the plus (+) icon to see the details of individual order as shown below
- Top Selling Products: As the name suggests, the table shows you a list of top selling items from your connected stores with percentage volume for each product.
Exporting Dashboard Data
There is an Export button on the top left hand corner of each chart. The available export options are:
- Print: This option creates a printable version of the chart or table
- Excel: This option exports the data into Excel spreadsheet format
- CSV: This option exports the data to a comma separated value file.
- PDF: This option generates a downloadable pdf file of the chart or the table
